

Economic & Market Monitor
For the period ending July 10, 2026
Market Review
Geopolitical Tensions Escalate: Middle East tensions flared again last week as the fragile U.S.-Iran ceasefire effectively broke down. Iran attacked commercial shipping in the Strait of Hormuz and U.S.-linked facilities in Gulf states. The U.S. responded with numerous attacks on Iranian military targets and critical infrastructure. Despite the renewed fighting, the U.S. signaled its intention to continue pursuing a peace agreement. West Texas Intermediate futures reached a high of $76 per barrel on Wednesday but settled on Friday at $71.41, up just $2.72 for the week, on expectations that a peaceful resolution will ultimately be achieved.
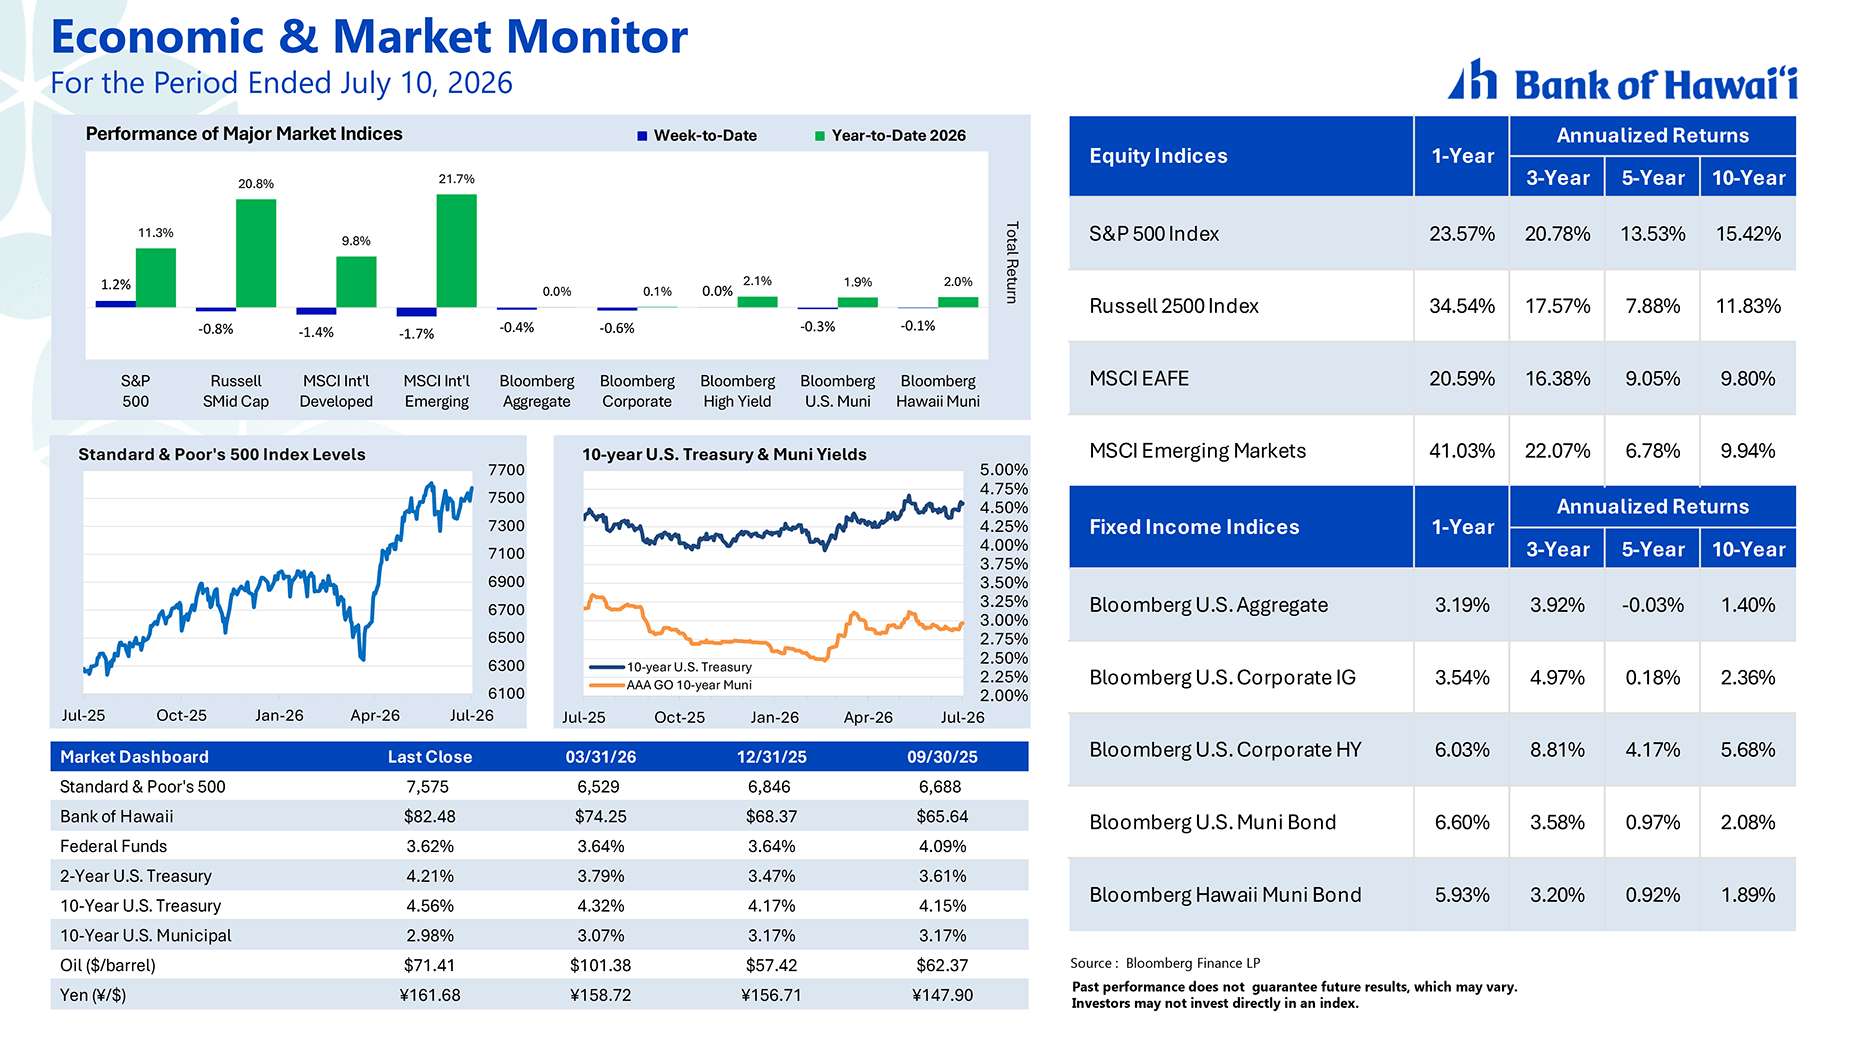
A Muted Response in Global Financial Markets: The S&P 500 advanced 1.2% bringing its year-to-date return 11.3%. Sector performance was mixed, with AI-related and energy stocks posting the largest gains, while consumer staples and materials stocks posted the largest losses. Abroad, developed and emerging markets slipped 1.4% and 1.7%, respectively, trimming their year-to-date returns to 9.8% and 21.7%.
Interest Rates Edged Higher: The yield on 10-year U.S. Treasury notes settled on Friday at 4.56%, up 0.08% for the week. The Bloomberg U.S. Aggregate Bond Index and the Bloomberg U.S. Municipal Bond Index slipped 0.4% and 0.3%, respectively. As of Friday, the year-to-date returns for the two indexes stood at 0.0% and 2.0%, respectively.
Fed Minutes Reveal Diverging Views on Rate Policy: Minutes from June’s Federal Open Market Committee (FOMC) meeting revealed a degree of disagreement among policymakers over the future path of monetary policy. While a few officials saw a case for raising interest rates, the FOMC voted to hold rates steady. Committee members acknowledged elevated uncertainty surrounding the economic outlook and the wide range of scenarios that could unfold over the remainder of the year.
Economy in Expansion Mode: S&P Global’s final June U.S. Composite Purchasing Managers Index (PMI) came in at 51.9, compared with 52.2 in May. PMI readings above 50 reflect expansionary economic conditions.
Labor Market Holding Steady: The Labor Department reported that initial claims for unemployment benefits for the week ended July 4 were 215,000, down 2,000 from the prior week. Continuing claims for the week ended June 27 rose by 8,000 to 1.814 million, in line with consensus forecasts. Both measures remain well below their long-term averages and are reflective of firm labor market conditions.
Outlook
Aside from ongoing developments in the U.S.-Iran conflict, investor attention this week will be focused on inflation, consumer spending, and second-quarter corporate earnings reports.
Inflation: The Bureau of Labor Statistics will release its June Consumer Price Index (CPI) on Tuesday and its June Producer Price Index (PPI) on Wednesday. Bloomberg median forecasts for CPI and Core CPI (excluding food and energy), measured year-over-year, are 3.8% and 2.9%, respectively, compared with 4.2% and 2.9% in May. Median estimates for PPI and Core PPI are 6.2% and 5.2%, respectively, compared with 6.5% and 4.9% in May.
Retail Sales: The Commerce Department is scheduled to release June retail sales on Thursday. The Bloomberg median estimate calls for a 0.4% month-over-month gain, a slowdown from May's robust 0.9% advance.
Second Quarter Earnings Reports: The second-quarter corporate earnings reporting season will be in full swing this week, led by several major U.S. banks. The economy appears to have held up well through the quarter despite Middle East-related uncertainty. Analysts tracked by I/B/E/S estimate S&P 500 second-quarter EPS growth of 23.7% year-over-year. If achieved, this would mark the seventh consecutive quarter of double-digit growth. Analysts estimate full-year 2026 S&P 500 EPS growth at 26.5%.
Roger Khlopin, CFA
Chief Investment Officer
Aaron Nghiem, CFA, CIMA
Senior Portfolio Manager
This material is provided for educational purposes only and is not intended to be relied upon as a forecast, research, or investment advice, and is not a recommendation, offer or solicitation to buy or sell any securities or to adopt any investment strategy. Bank of Hawaii and its affiliates do not provide tax, legal or accounting advice. This material is not intended to provide, and should not be relied on for, tax, legal, or investment advice. You should consult your own tax, legal, accounting or financial professional before engaging in any transaction. Neither the information nor any opinions expressed herein should be construed as a solicitation or a recommendation by Bank of Hawaii or its affiliates to buy or sell any securities, investments, or insurance products. Investing involves market risk, including possible loss of principal, and there is no guarantee that investment objectives will be achieved. Past performance is not a guarantee of future results.
You're about to exit BOH.com
Links to other sites are provided as a service to you by Bank of Hawaii. These other sites are neither owned nor maintained by Bank of Hawaii. Bank of Hawaii shall not be responsible for the content and/or accuracy of any information contained in these other sites or for the personal or credit card information you provide to these sites.
